Debugging failed Eventbridge invocation
When Eventbridge tries to send an event to a target and the delivery fails, by default only way to notice this is from FailedInvocation Cloudwatch Metric. The metric itself is not enough to get the actual reason why the event delivery is failing.
In general there are two options to debug FailedInvocaton issues:
- Debug on the resource level. If your Eventbridge Rule is targeting Lambda function, try to search for failed Lambda invocations from Cloudtrail logs.
- Forward failed deliveries to DLQ(Dead Letter Queue).
On this blog post I’m showing how to configure DLQ to Eventbridge target and how to write error logs to Cloudwatch Logs.
You can get full template from: https://github.com/markymarkus/cloudformation/blob/master/eventbridge-debug-dlq/template.yml
Walkthrough
We are starting with very basic AWS::Events::Rule on account 111111111111 which forwards events from custom.source to event bus on account 222222222222. FailedInvocation metrics shows that all the invocations are failing.
Enable error logging
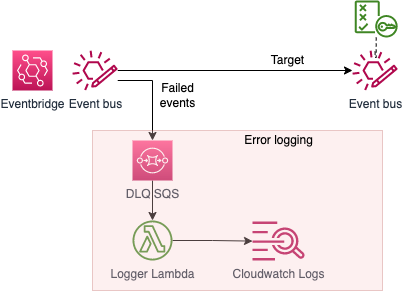
To get better understanding why events are not reaching a target eventbus, following resources are added:
- Set Eventbridge Target retry count to 0. Depending on error, Eventbridge retries to send event 24h before failing and sending the event to DLQ. Setting retry count to zero ensure that failed event is sent to DLQ asap.
- Configure DLQ(SQS) for failing target.
- Create Lambda function to get error messages from the DLQ(SQS) queue and writing error logs to Cloudwatch Logs.

Fig 1. Architecture
And this is how the configuration looks in Cloudformation template:
  CustomEventsRule:
    Type: AWS::Events::Rule
    Properties:
      EventBusName: !GetAtt CustomEventBus.Arn
      EventPattern:
        source:
          - custom.source
      State: ENABLED
      Targets:
        - Id: 'customtarget'
          Arn: 'arn:aws:events:eu-west-1:222222222222:event-bus/default'
          RetryPolicy:
            MaximumRetryAttempts: 0
          DeadLetterQueue:
            Arn: !GetAtt DLQueue.Arn
After dead letter queue setup is in place, wait for next failing invocation and open DLQ handler Lambda’s execution logs from Cloudwath Logs. ERROR_MESSAGE and ERROR_CODE fields have human readable reason why the sending is failing.
....
            "messageAttributes": {
                "RULE_ARN": {
                    "stringValue": "arn:aws:events:eu-west-1:111111111111:rule/custom_event_bus/dev-eb-debug-CustomEventsRule-3GTDO9NDN1Q9",
                    "stringListValues": [],
                    "binaryListValues": [],
                    "dataType": "String"
                },
                "TARGET_ARN": {
                    "stringValue": "arn:aws:events:eu-west-1:222222222222:event-bus/default",
                    "stringListValues": [],
                    "binaryListValues": [],
                    "dataType": "String"
                },
                "ERROR_MESSAGE": {
                    "stringValue": "Lack of permissions to invoke cross account target.",
                    "stringListValues": [],
                    "binaryListValues": [],
                    "dataType": "String"
                },
                "ERROR_CODE": {
                    "stringValue": "NO_PERMISSIONS",
                    "stringListValues": [],
                    "binaryListValues": [],
                    "dataType": "String"
                }
            },
This time the delivery was failing because of terminated Eventbridge Policy on the recieving AWS account.
Conclusion
In general DLQs require some logic to handle failed events. Adding alarm for failed Eventbridge invocation and logging via DLQ is the first step to understand if that logic should be developed further.